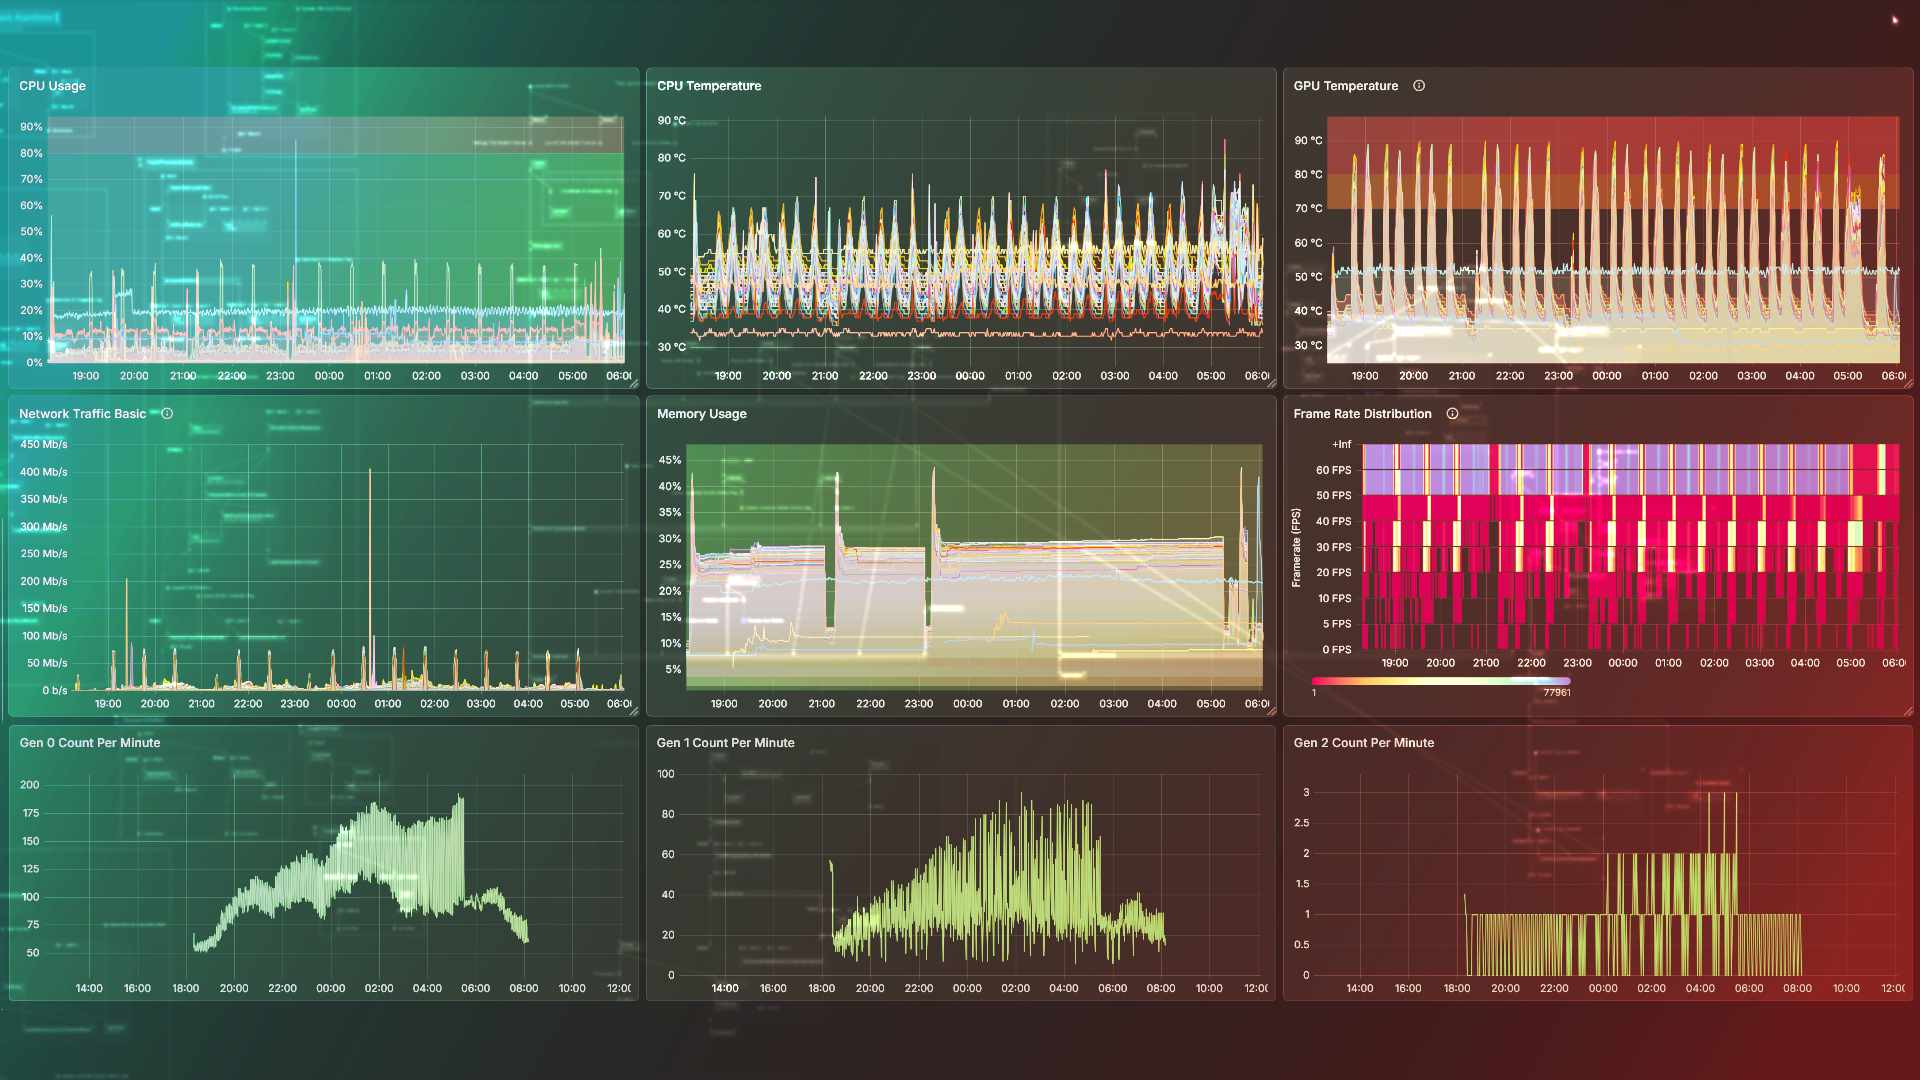
Track your installations’ GPU, memory and disk with Prometheus and Grafana.
1 Session at 3 hours, live in English language
Recordings will become available the day after the live lesson.
Digital art installations often run unattended for days. We usually lack a single pane of glass and a standardized way to observe our systems over time, and to answer questions like “How hot is my GPU?”, “How much memory is my application eating?”, or “Is my hard drive almost full?”. Slow issues like memory leaks stay invisible without tools that record system state.
Observability (abbreviated o11y) is the practice of collecting metrics from running systems to inspect their current state and history. This workshop introduces the standard stack: Prometheus stores metrics, exporters expose them, and Grafana visualizes them.
The session covers:
- How Prometheus scrapes exporters
- Running Prometheus and Grafana locally in Docker
- Instrumenting a vvvv patch with the VL.Prometheus vvvv plugin
- Building a Grafana dashboard from your own metrics
By the end you will have a working local stack and a patch reporting its own metrics, giving you a solid foundation to add monitoring to your installations.
What you will learn
- What you will learn
- The core concepts of o11y: metrics, exporters, scraping, and time-series data
- How Prometheus, exporters, and Grafana fit together as a stack
- Running Prometheus and Grafana locally with Docker
- Instrumenting a vvvv patch to expose your own metrics
- Building a Grafana dashboard from scratch
Requirements
- Windows computer with latest vvvv gamma installed
- 3 button mouse recommended
- Second monitor recommended
- A machine that can run vvvv gamma and Docker at the same time
- Docker Desktop installed (or Docker CLI if you know what you are doing)
- Basic familiarity with the command line
- Basic understanding of Docker concepts (what containers and images are)
- No prior knowledge of Prometheus, Grafana, or observability required